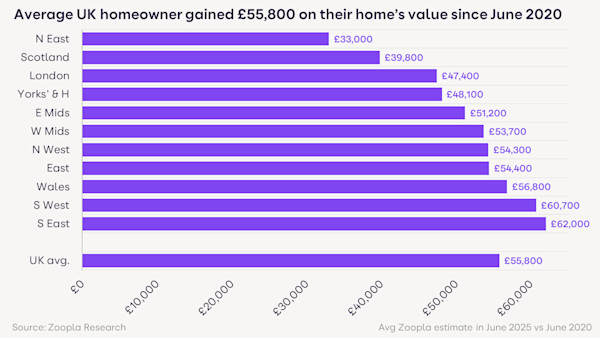
Our latest research reveals the truth behind house prices since the pandemic, and you might have made more on your home than you thought.
The average UK homeowner has seen 20% added to their home’s value since 2020, which works out to a gain of £55,800.
For some, the growth is even greater - 1 million homes are now worth at least 50% more, with an average gain of an impressive £117,400.
In fact, 8 in 10 homes (or 24 million across the UK) have risen in value by at least 5%, and are now worth £60,800 more in just 5 years.

Get an instant valuation of your home
Selling soon or just staying informed? Find out what your property’s worth in under 60 seconds.

How have property values changed in your region?
So what does it mean for those lucky enough to gain 50%+ in their home's value? We've broken down how the added value works out in pounds and pence across the UK.
Not bad reading for homeowners.
Region | % of homes increasing in value by 50%+ | Average value of these homes in June 2020 | Average value of these homes in 2025 | Average value change of these homes 2020-25 |
North West | 12% | £122,200 | £199,300 | £77,100 |
Wales | 11% | £140,100 | £230,800 | £90,700 |
Scotland | 6% | £129,900 | £222,900 | £93,000 |
Yorkshire and the Humber | 6% | £129,300 | £215,500 | £86,200 |
North East | 5% | £99,500 | £168,700 | £69,200 |
UK (all regions) | 5% | £167,900 | £285,300 | £117,400 |
East Midlands | 4% | £163,000 | £277,300 | £114,300 |
West Midlands | 4% | £166,900 | £278,200 | £111,300 |
South West | 3% | £287,200 | £503,500 | £216,300 |
South East | 2% | £387,700 | £687,300 | £299,600 |
East of England | 2% | £292,700 | £518,800 | £226,100 |
London | 1% | £454,100 | £825,100 | £371,000 |
The home value winners: Northern England and Wales
More than half of the UK homes with 50%+ value gains are in the North West, Yorkshire and the Humber, and Wales.
In the last 5 years, homes with 50%+ value growth saw average gains of:
£90,700 in Wales
£86,200 in Yorkshire and the Humber
£77,100 in the North West
The level of property value growth here is down to a combination of factors. The pandemic prompted lifestyle changes and new buyer requirements, boosting interest in previously overlooked areas.
At the same time, huge rental growth in cities and the late-2022 spike in mortgage rates has encouraged people to prioritise affordability and buy in lower-value areas.
This means that the most affordable areas have seen above-average buyer interest, pushing house prices up.
Growth hotspot: The South Wales Valleys
The Valleys area of South Wales has become a seriously sought-after spot in the last 5 years, driven by its unique combination of excellent value for money and close proximity to Cardiff.
Blaenau Gwent and Merthyr Tydfil have seen 3 in 10 homes increase in value by 50% or more over the last five years, an average of £51,100 and £49,900 respectively.
Growth hotspot: The North West
Urban areas in the North West have seen impressive house price growth since 2020, particularly in Liverpool, Manchester and the surrounding areas.
Homeowners in Rochdale, Bolton and Oldham are most likely to have seen their property’s value surge by 50% or more, with average gains of £64,300, £64,300 and £62,900 respectively.
Curious what your home's worth? Find out instantly
Whether you're ready to sell or just keeping tabs on the market, get a free online valuation of your property in under 60 seconds. No fuss, just numbers.

The home value losers: London and the South of England
Okay, we don’t mean it when we say ‘losers’ - but there’s a chance your home has lost value since 2020 if you live in the South of England.
The good news is that value losses are pretty limited. In fact, most southern homes have seen small value increases since the pandemic, particularly as the London ‘virtual’ commuter belt has expanded - they’re just not as high or widespread as in Wales and the North.
London: Property values fall in inner boroughs
The value losses have mainly happened in London, where 13% of homes have lost 5% or more - an average of £34,000.
Westminster and Kensington & Chelsea are the worst off, with almost half of all homes now valued below their June 2020 estimates.
On the flip side, the previous exceptional value growth in these areas will offset much of these house price losses for many homeowners.
London’s housing market has faced challenges in recent years, with high house prices and mortgage rates impacting first-time buyer demand and rate and tax changes discouraging landlord investment.
South of England: Small gains work out to big cash boost
The South of England has seen modest value growth, with 51% of southern homes gaining up to 20% in value. These rises have averaged £62,000.
The lower growth is a result of house values already being higher in the south, along with high mortgage rates impacting demand and keeping values steady.
The homes that gained more value tend to be located in desirable coastal spots and areas of natural beauty. The Isle of Wight is one example, where homes with 50% gains added £182,400 on average.
And although the percentage increase is lower, high house prices equate to a huge cash boost in the South East, with homes now worth £62,000 more than 5 years ago on average.

Let’s zoom in: The local areas with the most property value gains
We’ve also looked at the UK local authority areas with the highest percentage of homes that have gained 50%+ in value since 2020.
Widespread property value gains in smaller markets point towards consistent value growth that’s likely to convert to higher sale prices.
Does your area make the top 10 for value growth in the UK?
Local authority | Region | % homes increasing in value by 50%+ | Average value of these homes in June 2025 | Average value change (£) from June 2020-25 |
Oldham | North West | 35% | £164,000 | £62,900 |
Blaenau Gwent | Wales | 32% | £132,300 | £49,900 |
Barnsley | Yorkshire and Humber | 13% | £151,400 | £56,400 |
Argyll and Bute | Scotland | 12% | £249,700 | £110,800 |
Sandwell | West Midlands | 11% | £211,600 | £78,400 |
Bolsover | East Midlands | 9% | £146,200 | £55,500 |
Middlesbrough | North East | 9% | £93,200 | £35,200 |
Cotswolds | South West | 6% | £777,500 | £361,600 |
North Norfolk | East of England | 5% | £418,300 | £216,700 |
Isle of Wight | South East | 4% | £451,400 | £182,400 |
Waltham Forest | London | 2% | £672,000 | £365,000 |
The expert’s advice: “It’s critical to understand your local market dynamics when moving”
Richard Donnell, Executive Director at Zoopla, reflects on the research, adding some advice for those thinking about moving.
“Our latest analysis clearly shows there is no single housing market and that house price trends vary widely across the UK.
“1 million UK homes have seen their value increase by 50% or more over the last 5 years as higher mortgage rates and rising rents encourage home buyers to seek out value for money in localised markets across northern England and Wales.
“Home value growth has been weaker across southern England and particularly in London. A combination of high prices and higher mortgage rates have reduced buying power and this has been reflected in flat prices and modest price falls in inner London.
“The UK currently has the most homes for sale in 7 years. It’s critically important that serious sellers fully understand the local market dynamics impacting the value of their home and seek the advice of agents on where to set their asking price in order to achieve a sale."
My Home: track your home's value
Discover how much your home could be worth, track its changing value over time and find out what homes in your area have sold for.


